Please find below the recordings and resources from our online demo day held on April 26, 2022.
Don't miss your chance to attend our free seminars with live demonstrations and mini-courses covering our most popular software for researchers, engineers and developers.
Sign up for our free newsletter and get notified when we run our next free webinars.
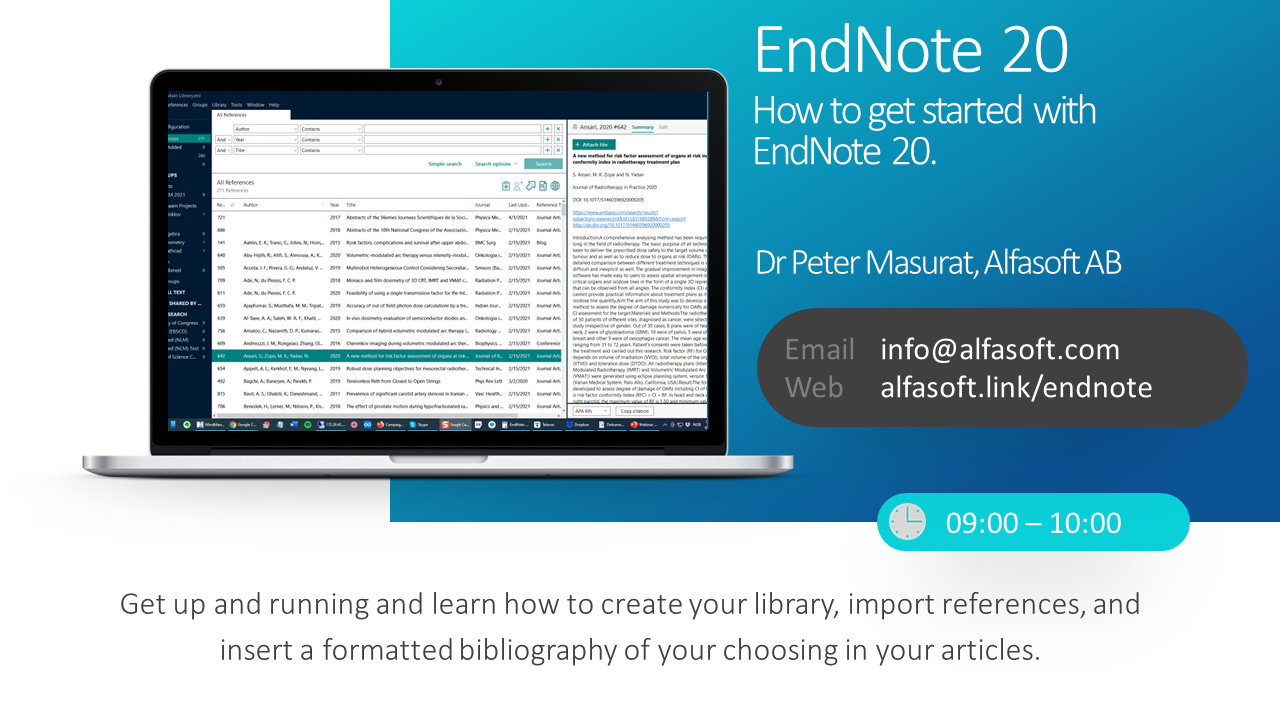
How to get started with EndNote and Reference Management
Get started with EndNote 20 and learn the basics. In this webinar you will learn how to set up your own library, import references and PDF documents, and cite-while-you-write in Word.
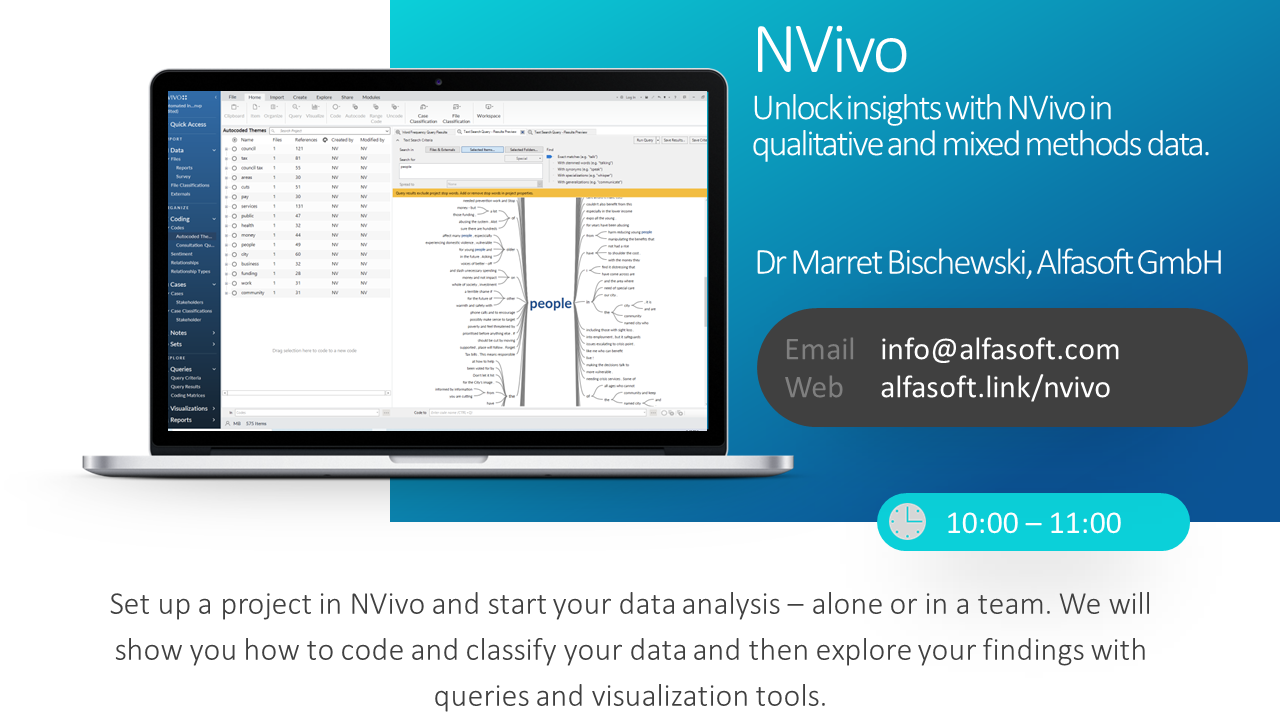
Unlock insights in qualitative and mixed methods data
NVivo is a powerful software for qualitative data analysis. With intuitive tools it will help you to quickly gain relevant insights from your data. Set up a project in NVivo and start your data analysis – alone, or in a team. We will show you how to code and classify your data and then explore your findings with queries and visualization tools.
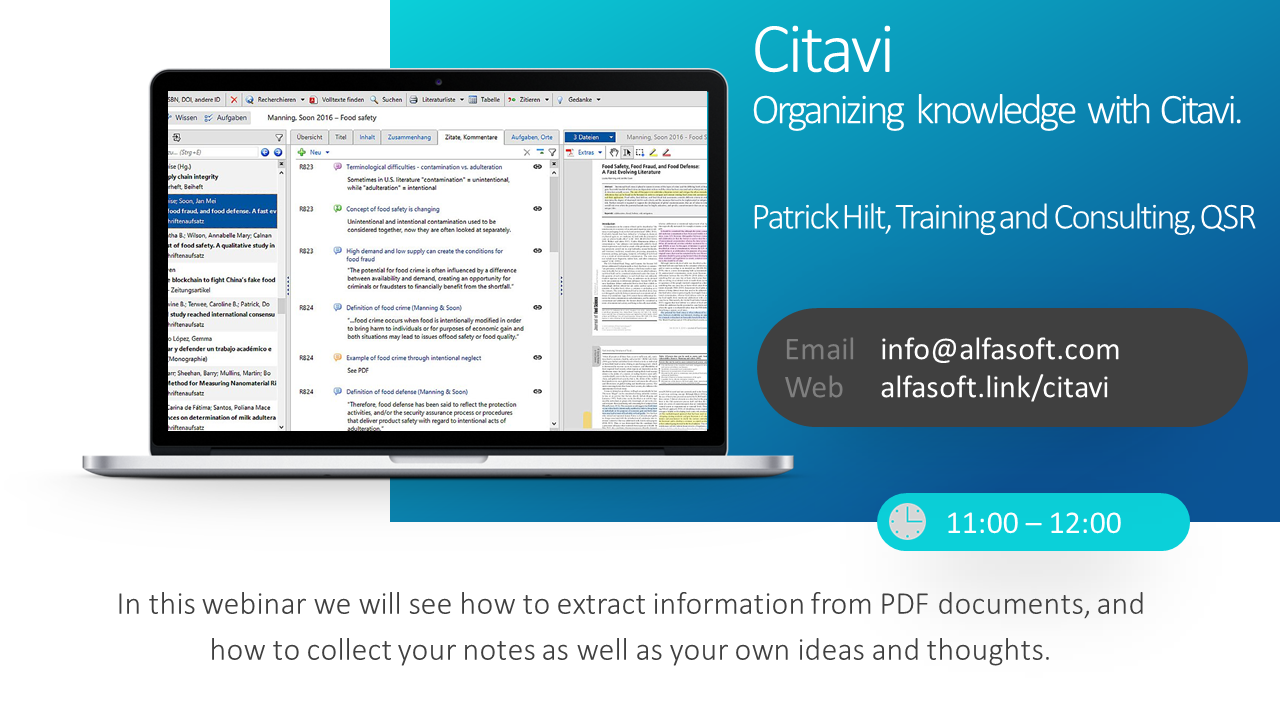
Organizing knowledge with Citavi
In this webinar we will see how simple it is with Citavi to extract information from pdf documents, and how to collect your notes and comments on individual passages as well as your own ideas and thoughts.
All those elements can then be structured in a meaningful way, which speeds up the writing and publication process, and at the same time gives you full control over the accumulated knowledge without ever forgetting anything or losing track of individual items, even in large projects like a PhD thesis.
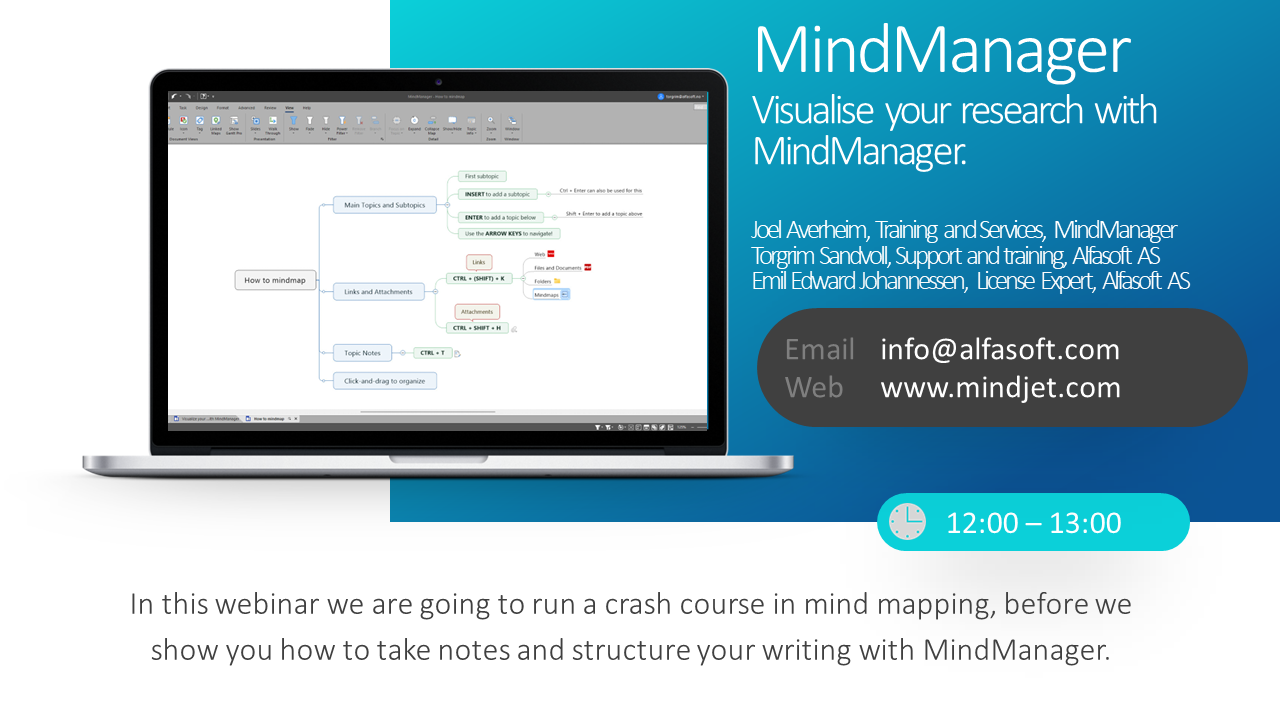
Visualise your research with MindManager
Capture, structure, and organize information easily. One of the most common uses for MindManager is as a personal organizer. With so much coming at us every day, it’s important to have a central dashboard to keep track of to-dos, organize documents, take notes, and saving your best ideas.
In this webinar we are going to show you some use cases for MindManager, then run a crash course in mind mapping, before we show you how to take notes and structure your writing with MindManager.
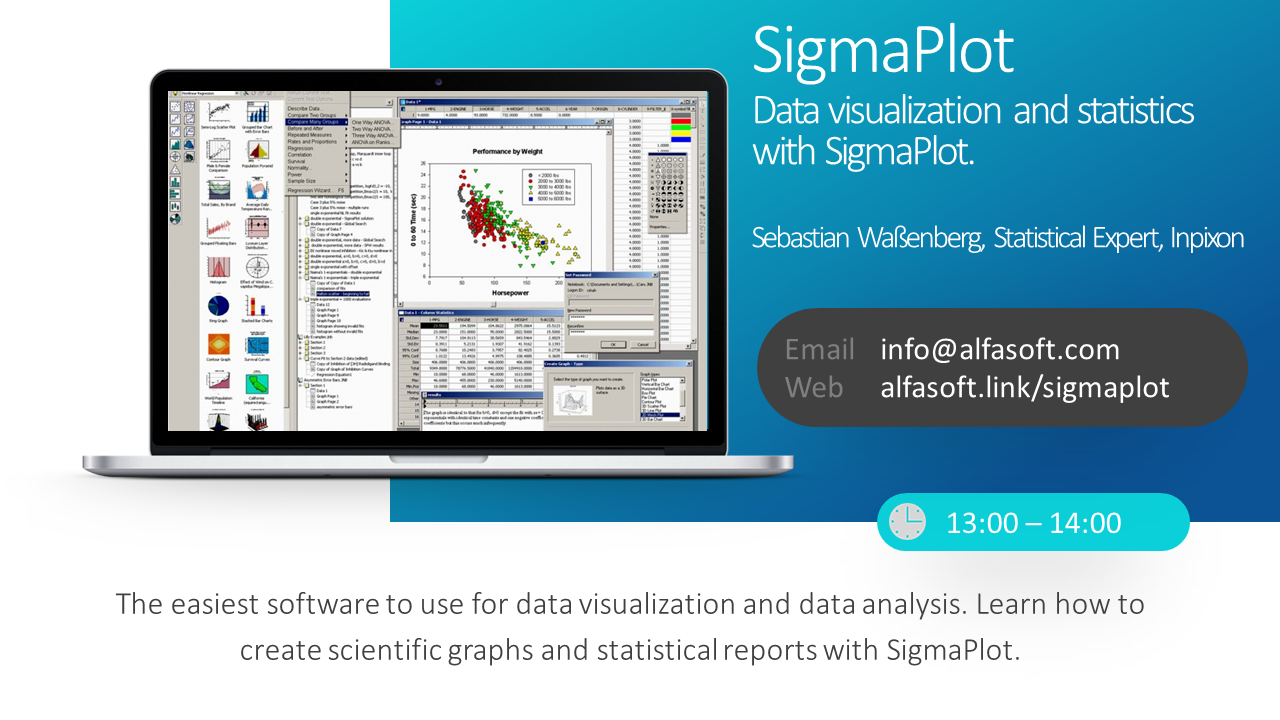
Data visualization and statistics with SigmaPlot
SigmaPlot is recognized as one of the easiest tools to use for data vizualization and data analysis. Learn how to create scientific graphs and statistical reports with SigmaPlot in this webinar.
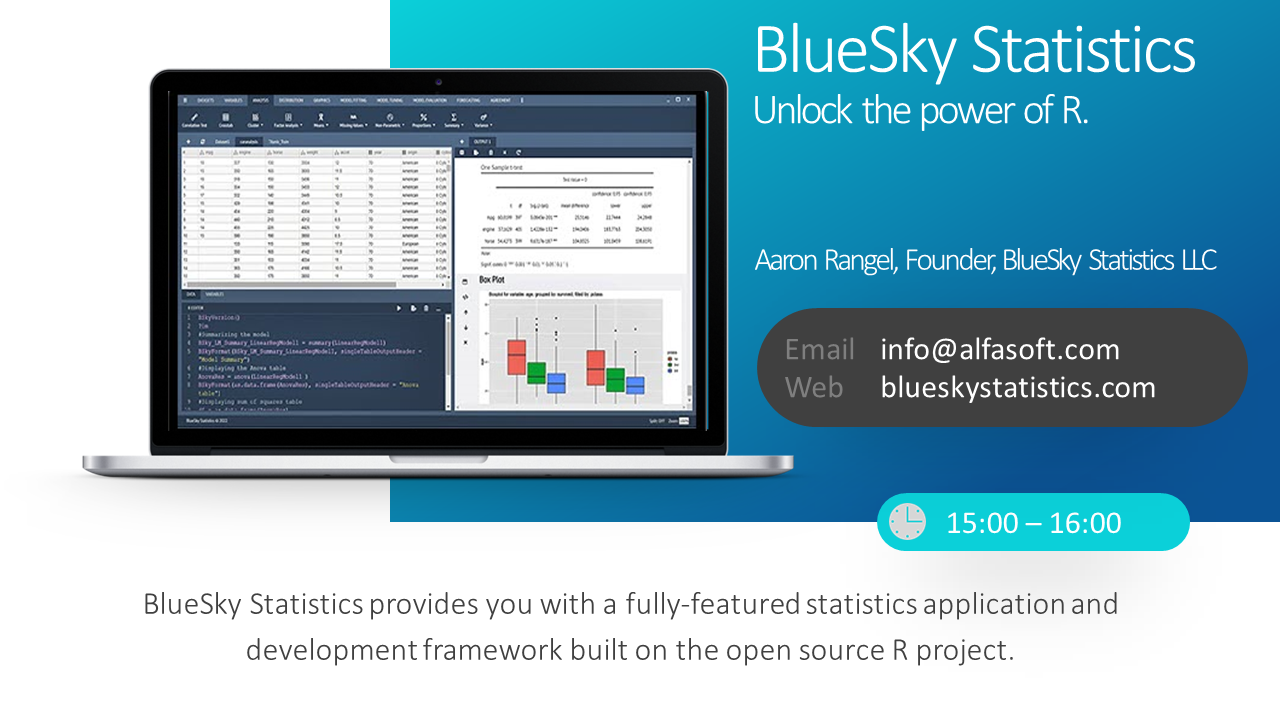
Unlock the power of R
BlueSky Statistics provides you with a fully-featured statistics application and development framework built on the open source R project, giving you a powerful and familiar user interface through which to manipulate R.
BlueSky Statistics unlocks the power of R for the analyst community by providing a rich GUI and output for many popular statistics, data mining, data manipulation and graphics commands, all out of the box.